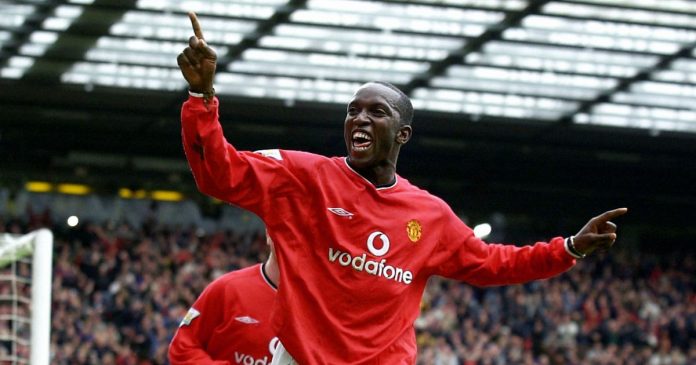
Over the nineteen year history of the English Premier League, Manchester United can easily claim to be the best team in England. They’ve won twelve titles – five more than the rest of the league put together.
The Premiership handed out their own awards in 2002 in celebration of some of the great moments the league had seen. But so far, there hasn’t been – beyond titles won – a stark, quantifiable method of evaluating which teams have been the best-performed in the EPL. As a follow-up to the Premier League’s ten-year table, we expanded that analysis to include the entire history of the League. Based upon each team’s performance, the best-performed twenty teams over those nineteen years have been:
| Team | Years | Title | Range | Top 4 | Top 10 | Relegations | Pts | Avg | Avg GD |
| Manchester United | 19 | 12 | 1 to 3 | 19 | 19 | 0 | 1574 | 82.84 | 43.42 |
| Arsenal | 19 | 3 | 1 to 12 | 16 | 10 | 0 | 1379 | 72.58 | 32.2 |
| Chelsea | 19 | 3 | 1 to 14 | 11 | 10 | 0 | 1338 | 70.42 | 27.37 |
| Blackburn Rovers |
17 | 1 | 1 to 19 | 3 | 11 | 1 | 938 | 55.18 | 2.94 |
| Liverpool | 19 | 0 | 2 to 8 | 15 | 19 | 0 | 1262 | 66.42 | 26 |
| Aston Villa | 19 | 0 | 2 to 18 | 2 | 15 | 0 | 1053 | 55.42 | 3.95 |
| Leeds United | 12 | 0 | 3 to 19 | 3 | 7 | 1 | 692 | 57.67 | 5.67 |
| Everton | 19 | 0 | 4 to 17 | 1 | 7 | 0 | 977 | 51.42 | -0.4 |
| Tottenham | 19 | 0 | 4 to 15 | 1 | 13 | 0 | 1017 | 53.53 | 1 |
| Newcastle United |
17 | 0 | 2 to 18 | 2 | 8 | 1 | 952 | 56 | 6.82 |
| Manchester City | 14 | 0 | 3 to 18 | 1 | 7 | 2 | 694 | 49.57 | -2.07 |
| Sheff. Wednesday | 8 | 0 | 7 to 19 | 0 | 3 | 1 | 392 | 49 | -6.88 |
| West Ham United |
16 | 0 | 5 to 20 | 0 | 8 | 2 | 764 | 47.75 | -9.81 |
| Derby County | 7 | 0 | 8 to 20 | 0 | 2 | 2 | 274 | 46.6 | -21.29 |
| Stoke City | 3 | 0 | 11 to 13 | 0 | 0 | 0 | 138 | 46 | -11 |
| Fulham | 10 | 0 | 7 to 17 | 0 | 3 | 0 | 459 | 45.9 | -6.9 |
| Coventry City | 9 | 0 | 11 to 19 | 0 | 0 | 1 | 409 | 45.44 | -11.44 |
| Southampton | 13 | 0 | 8 to 20 | 0 | 3 | 1 | 587 | 45.15 | -10 |
| Charlton Athletic | 8 | 0 | 7 to 19 | 0 | 2 | 2 | 361 | 45.13 | -12.5 |
| Bolton Wanderers |
12 | 0 | 6 to 20 | 0 | 4 | 2 | 539 | 44.92 | -11.58 |
Note: These are raw figures, uncorrected for the 1992-1995 EPL seasons which featured twenty-two teams and forty-two games per season. For more details, visit Balanced Sports Cumulative EPL Tables page.
Surprises include Blackburn Rovers’ elevated position – courtesy of Jack Walker’s generous investment during the early 1990s – and that teams so nondescript as Coventry City and Derby County making the grade above teams with higher pedigrees such as Leicester City and Middlesbrough. That Derby County made the cut after their disastrous 2007-08 season comprising 11 points and a record goal difference of -69 is nigh-on miraculous; it is counterbalanced by some impressive seasons ranking them in the bottom of the top half of the table in the late 1990s.
Special mention must be made of Nottingham Forest, the only club not ranking in the above Top 20 who finished in the Top 4 – their third place finish in 1995 after promotion the previous year from the second tier. That achievement is counterbalanced by three separate relegations in only five years. The only club who suffered relegation more frequently than Forest was Crystal Palace, who endured four separate Premiership seasons only to go down each time.
For how every team has fared in the Premiership since it’s inception, visit the Balanced Sports’ Cumulative Premiership tables page.
Matthew Wood writes at Balanced Sports. You can also follow him on Twitter @balanced_sports
Add Sportslens to your Google News Feed!


