
With the January transfer window now firmly shut it has restored an element of calm in the world of football once again. The twice-annual rush for signatures is behind us and I think it is fair to say that everyone connected with the game will be breathing a huge sigh of relief.
With just over three months of the domestic season to go, the 20 men who are fortunate enough to have the title of Premier League manager now know which personnel they will have at their disposal between now and the end of the campaign.
Each 25-man squad is now settled until May with no-one coming in or going out, there can be no more astute purchases or panic buys as the respective battles up and down the table now enter the final rounds.
But now that the dust has settled on a hectic January, it also gives us the perfect opportunity to analyse the business that has taken place at the start of this year. We won’t really know if it is good or bad until the end of the season, but we can at least make sense of the deals that have taken place.
2018 was hardly a year for financial prudence as far as the 20 top flight clubs were involved, if anything far from it. That is because between them they spent £419.5m, that is an average of just under £21m per club.
Not only that but it dwarfed the amount spent 12 months ago, there was an increase on year on year spending to the tune of £182.8m as by comparison £236.7m was spent in the 2017 January window.
If we look at the January transfer spend in the Premier League over the past four years,
(source: Skysports.com)
| Year | PL Spending (£m) |
| 2018 | 419.5 |
| 2017 | 236.7 |
| 2016 | 117.5 |
| 2015 | 118.2 |
You can see that the rate of spending has accelerated considerably, in just the past 12 months there has been a 77.23% increase in terms of total spend, while if we compare the 2015 total spend to this year then the percentage increase is 254.91%
The sizeable increase in spending has undoubtedly been helped by the current TV deal, one that has allowed even the smallest teams in the league to flex their financial muscle and with the announcement of a new deal imminent then it is fair to assume that the total spend in 2019 could go on to be even greater.
The fact that this current TV deal has allowed every Premier League member to spend on a large scale has certainly levelled the playing field in terms of who is able to sign the most talented players but just where were the biggest deals in January 2018?
If we now look at the 10 biggest transfers in the Premier League in January 2018 (source BBC Sport)
| Player | Former Club | New Club | Fee |
| Virgil van Dijk | Southampton | Liverpool | £75m |
| Aymeric Laporte | Athletic Bilbao | Manchester City | £57m |
| Pierre-Emerick Aubameyang | Borussia Dortmund | Arsenal | £56m |
| Henrikh Mkhitaryan | Manchester United | Arsenal | £36m* |
| Alexis Sanchez | Arsenal | Manchester United | £36m* |
| Cenk Tosun | Besiktas | Everton | £27m |
| Lucas Moura | PSG | Tottenham | £23m |
| Adrien Silva | Sporting Lisbon | Leicester | £22m |
| Theo Walcott | Arsenal | Everton | £20m |
| Guido Carrillo | Monaco | Southampton | £19m |
| Total Value | £371m | ||
| Minus Swap Deal | £299m |
You will see that these transfers had a value of £371m, although only £299m changed hands, this was because a value of £36m was apportioned to both Henrikh Mkhitaryan and Alexis Sanchez but because there was the rarity of a straight swap deal that took place, no money was exchange between the two clubs.
Even so there was still £299m spent in terms of cash from these top 10 January transfers, which when we compare that to the overall spend of that month it means that 71.28% of all expenditure came from these deals.
Not only that but of that £299m that changed hands, £280m was from clubs that are currently in the top half of the table (at the time of writing 2/2/18) meaning that the big deals have been the preserve of the bigger clubs this time around.
However, expenditure is only one measure of a club’s transfer business but the metric that gives us more context is net spend. It’s all very well spending a lot of money but ultimately the books must be balanced and in the table below we can see who did the best job at this.
| Club | Net Profit/Loss (£m) |
| Southampton | 55.9 |
| Liverpool | 32.0 |
| West Ham | 12.5 |
| Newcastle | 0.0 |
| Bournemouth | 0.0 |
| Manchester United | 0.0 |
| Burnley | -1.3 |
| West Brom | -1.4 |
| Leicester | -3.0 |
| Watford | -9.4 |
| Arsenal | -9.4 |
| Crystal Palace | -10.5 |
| Huddersfield | -11.0 |
| Brighton | -14.5 |
| Swansea | -18.0 |
| Stoke | -20.0 |
| Tottenham | -25.0 |
| Everton | -29.8 |
| Chelsea | -50.6 |
| Manchester City | -60.8 |
As you can see Southampton may be struggling to beat the drop, but they have come out on top in this table. However, that will be of little comfort to their fans as the sale of Virgil van Dijk to Liverpool for £75m then saw just £19m spent in return with the arrival of Guido Carrillo from Monaco.
The Saints may well have swelled their coffers at the start of the year, but they could go on to be one of the richest clubs in the EFL Championship if results do not approve, hindsight is a wonderful thing and only come May will the board know if they should have spent more of their recent windfall.
Liverpool played a big part in Southampton’s newly found riches but they themselves are sitting comfortably in the black after January’s dealings, they may have spent £75m on Virgil van Dijk a fee which subsequently sees them break the world record transfer fee for a defender, but they also recouped £142m after selling Philippe Coutinho to Barcelona.
This sees them sit second in the net spend table and they are only one of three clubs to have made a profit in January 2018. The other being West Ham who made one to the tune of £12.5m, this was mainly thanks to Andre Ayew’s return to Swansea on transfer deadline day.
However, like Southampton, West Ham have drawn the ire from their fans for not bringing in new names especially as they are still one of many clubs who are doing their best to stave off the threat of relegation.
Again, we will only know the true measure of their transfer activity or lack thereof come the end of season, should they stay up then the lack of expenditure will be fully justified but should they suffer from the pitfalls of demotion then it will make for uncertain times in East London.
If we plot the data from the 20 Premier League clubs in terms of their net profit/loss in January 2018 it looks as follows:
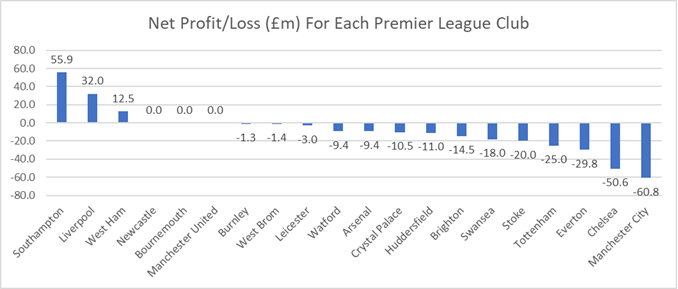
As you can see, three of what we know as the ‘Big Six’ find themselves in the four clubs that have the biggest net loss in January 2018. That trio of clubs being Tottenham, Everton and Manchester City while the other of this quartet is Everton.
If we keep those 20 teams in the order in which they sit in the net spend table but map them to their current league placing (as of 2/2/18) then we can see just what correlation, there is between the two measures.
Firstly, if we look at each club’s league position in relation to net spending
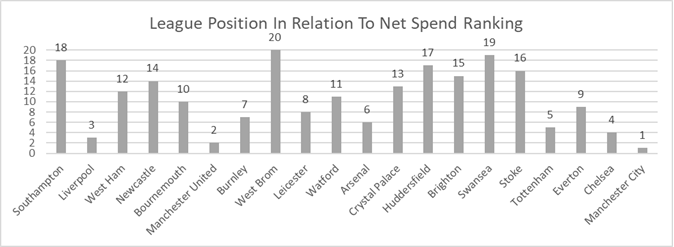
Logic may well dictate that the teams at the top of the net spend table would have the lowest league (in terms of placing not physical number) position therefore the trend line would slope down from the top left where Southampton are to Manchester City at the bottom right.
If we now add in a trendline we can see if the graph works to the same logic
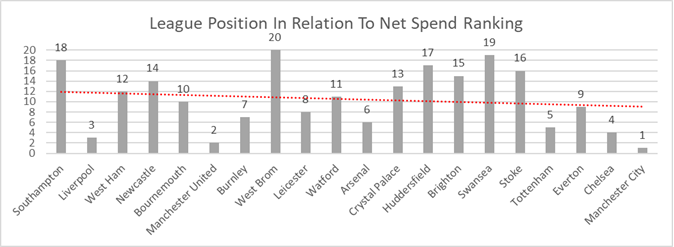
Although there is a slight downward trend it is not as sharp as first expected, this can be explained by the fact that the likes of Liverpool and Manchester United sit in the left-hand side of the graph (bottom 6) when they should be a lot closer to that of the right-hand side (top 6).
Therefore, the notion that the biggest clubs in the country will make the biggest losses is dispelled here but again this comes with the caveat that had Liverpool not sold Philippe Coutinho then they would have been sitting comfortably between Everton and Chelsea at the other end of the chart.
As you can see from the graph above there is nowhere near a natural decline from left to right with many clubs not sitting where they should in relation to their league placing, because of this there are many peaks and troughs in the chart above.
But just how do the two metrics of net spend and league placing (as of 2/2/18) compare?
If we look at this table of data, we can begin to get a better idea
First if I explain the key, the first two columns are what you have already seen above but there are now three additional columns those being:
Transfer Rank: The ranking of where the club sits in the net spend table (1 is the team with the most profit, 20 the team with the biggest loss)
League Rank: Each clubs league position as of 2/2/18
Variance: The figure when subtracting the League Rank from the Transfer Rank
| Club | Net Profit/Loss (£m) | Transfer Rank | League Rank | Variance |
| Southampton | 55.9 | 1 | 18 | -17 |
| Liverpool | 32.0 | 2 | 3 | -1 |
| West Ham | 12.5 | 3 | 12 | -9 |
| Newcastle | 0.0 | 4 | 14 | -10 |
| Bournemouth | 0.0 | 4 | 10 | -6 |
| Manchester United | 0.0 | 4 | 2 | 2 |
| Burnley | -1.3 | 7 | 7 | 0 |
| West Brom | -1.4 | 8 | 20 | -12 |
| Leicester | -3.0 | 9 | 8 | 1 |
| Watford | -9.4 | 10 | 11 | -1 |
| Arsenal | -9.4 | 10 | 6 | 4 |
| Crystal Palace | -10.5 | 12 | 13 | -1 |
| Huddersfield | -11.0 | 13 | 17 | -4 |
| Brighton | -14.5 | 14 | 15 | -1 |
| Swansea | -18.0 | 15 | 19 | -4 |
| Stoke | -20.0 | 16 | 16 | 0 |
| Tottenham | -25.0 | 17 | 5 | 12 |
| Everton | -29.8 | 18 | 9 | 9 |
| Chelsea | -50.6 | 19 | 4 | 15 |
| Manchester City | -60.8 | 20 | 1 | 19 |
Note: Bournemouth, Newcastle and Manchester United share transfer rank – 4 due to joint expenditure, while Watford and Arsenal share transfer rank 10 for the same reason.
Here it is the variance figure in which we are most interested in as this will tell us just what disparities there are between net spend and where each team lies in the Premier League at present.
The logic here should be that the teams at the top of the Premier League should have the largest variance between transfer rank and league rank. A perfect example of this would be Manchester City lying 20th in the transfer table and 1st in the league table, giving them a variance of 19.
As you can see this is something that does occur in the graph below, so by extension of that logic Manchester United should then lie 19th in the transfer table and 2nd in the league table, giving them a variance of 17, but if you look below this is not the case as they only have a variance of 2.
This is explained by the fact that although they do lie second in the Premier League they were as high as joint fourth in the net spend table therefore there was hardly any difference into the two metrics, which goes a large way against the theory that has been set out
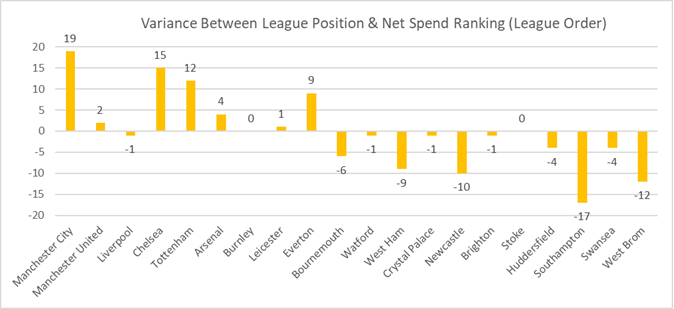
Here now is the variance between where a club sits in the Premier League and where it sits in the net spend table
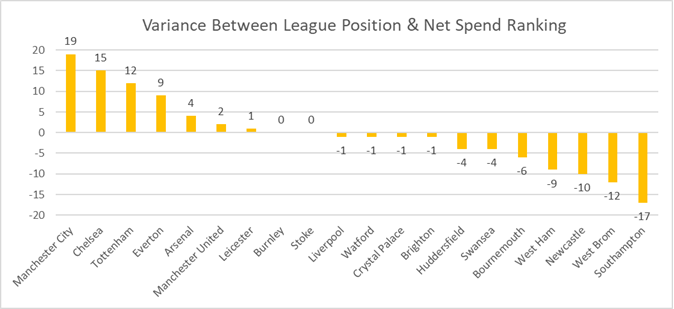
Three of the top six clubs have the highest variance between the two metrics, but it is not the top three in the table. For Manchester United and Liverpool, you can instead read Chelsea and Tottenham while Everton who were one of the four clubs to have the largest losses in January also sit in the top four in terms of variance. While at the opposite of the graph there is a strong correlation between the teams in the drop zone and those with the largest negative variance. West Brom and Southampton both sit in the bottom three and are the two teams with the largest difference between their net spend and their league standing.
What we will now do is take that variance data and map it against the Premier League table

Again, what we should see is the highest positive numbers on the left-hand side then sloping down to break even and then seeing the highest negative numbers to the right. We do see this with Manchester City and to a certain degree with West Brom but between the two there is huge mismatch in terms of correlations.
If we assume that the trendline is again meant to be a sharp diagonal line from left to right, here is what it looks like:
It is perhaps not as sharp as expected but the trend certainly does slope from left to right, again the angle of the decline is lessened due to there are a number of clubs in the top half with such a small variance figure.
What should happen if the data matched the logic is that the first ten teams should all have a high positive variance, this means that they sit in the top half of the Premier League table but have also have the biggest net losses in January
When we look at the first ten clubs though, Liverpool have a minus figure meaning they have turned a profit while Burnley have a zero variance, meaning the two-metrics match indicating that they have spent very little in relation to their current league standing.
If the hypothesis was, do the teams in the top 10 have the biggest net losses in January, then the graph above would comfortably disprove that. If we also took a second hypothesis, that being do the teams in the bottom 10 have the biggest net profits in January then the graph would also comfortably disprove that.
Where we assume that the top 10 teams would have high positive variance figures then the teams in the bottom would have high negative variance figures, that has happened in some cases such as Southampton and West Brom but then teams such Stoke, Crystal Palace, Watford and Brighton have broken that trend.
This is because in relation to where they currently lie in the Premier League there is little or no difference in relation to their transfer activity in January 2018. But for that quarter of clubs this can well be explained by a lack of getting deals completed.
For the likes of Crystal Palace and Brighton the will was certainly there to spend money especially when looking for an attacker to help their battle against relegation but try as they might they could not get any desired deals over the line.
Should that have been the case then their variance would have been a small positive one, again moving further away from the notion that it is the teams at the top half of the table have the biggest net losses in January
This can ultimately be explained by the fact that the January transfer window is perhaps more the preserve of the teams at the wrong end of the table, for them it is a final opportunity in which to add personnel to their ranks in a bid to maintain their top-flight status.
For them January often resembles a last roll of the dice with the punts by club managers and chairman becoming ones that are deemed more speculative, that said are two schools of thought in play here.
Do you roll the dice and try and spend your way out of trouble or do you aim for financial prudence and hope that the players you already have can stave off relegation come the end of the season, for Southampton they have seemingly opted for the latter while Swansea have decided to go for broke in their bid for survival as they landed a much-needed addition to their forward line.
It will be interesting to see just which of these two methods works in a few months, perhaps though the scrutiny should lie with Newcastle. They were one three teams to break even in January 2018 but that is not due to being great at accounting that was simply down to no expenditure or sales.
Rafael Benitez has long been frustrated in the transfer market not just in January but also last Summer and the fact that he has been restricted to loan deals means he has almost been working with one arm behind his back this season.
Will that transfer frustration come back to haunt both he and more importantly Mike Ashley, only time will tell but a lack of activity certainly does not bode well for the ardent fans of the St. James’ Park outfit.
Another thing to look for here is whether a new manager has been given the necessary funds in a bid to turn a club’s ailing fortunes around. That was definitely the case with Sam Allardyce as he spent a sizeable amount on both Theo Walcott from Arsenal and Cenk Tosun from Besiktas.
That outlay on these two players goes a long way to explaining why Everton recorded the third highest net loss out of all the Premier League teams in January last month, two other clubs to note in this example are Swansea and Stoke.
They have the fifth and sixth highest net losses respectively and this is in addition to the recent managerial appointments of Carlos Carvalhal and Paul Lambert respectively, the fact that these two clubs have recorded high net losses adds weight to the theory that new managers tend to be backed heavily in January.
it is also interesting that the four teams that have recorded the largest net losses also have the highest variance figure between league ranking and transfer ranking. Those being, Manchester City, Chelsea, Everton and Tottenham.
In that small sample alone, it shows that clubs that have spent big have also a high standing in the Premier League but once we reach Stoke who recorded the fifth highest net loss in January this theory no longer stands true.
In the January transfer window, the 20 Premier League clubs may have spent a total of £419.5m but they recorded a net loss of £164.3m. If we look at how this split between the teams that are currently in the top half of the table and the bottom (as of 2/2/18)
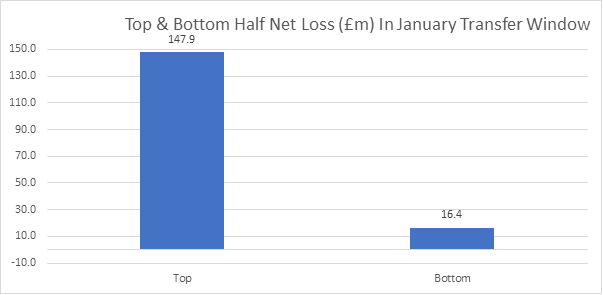
You will see that £147.9m of these losses were made by teams in the top 10, with just £16.4m coming from those in the bottom. This indicates that the biggest clubs have much more disposable incomes and do not have the immediate concerns of having to sell to buy.
This also means that of the net loss recorded in January 2018, 90.02% of it comes from clubs that currently sit in the top half of the table.
But what about if we took the same idea but compared the ‘Big Six’ against the rest
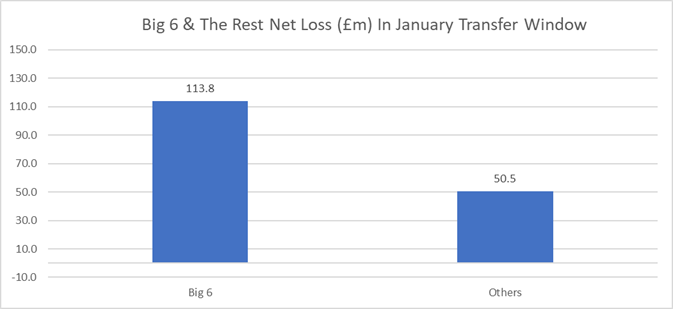
Here the net losses recorded by the ‘Big Six’ in January 2018 is £113.8m with the other two thirds of the Premier League recording net losses of £50.5m, this also means that 69.26% of the net losses come from just those half dozen clubs – they, of course, being Manchester City, Manchester United, Liverpool, Chelsea, Tottenham and Arsenal.
It also means that there is a £34.1m difference between the losses the top half are responsible for and the losses the top six are responsible for. This can almost be solely explained by Everton’s heavy net losses with the other three clubs who lie in the top 10 responsible for just £4.3m of net losses, that trio being Bournemouth, Burnley and Leicester.
This also throws up an interesting point in that the two of the aforementioned trio are already safe from relegation and therefore have no reason to make any January dealings, Leicester and Burnley could still enter the Europa League next season but neither Claude Puel or Sean Dyche has deemed it necessary to spend big as they seem relatively happy with what they have already got.
To conclude the analysis of January’s transfer window, Southampton and West Brom will perhaps be regretting their lack of expenditure especially if they succumb to relegation, it’s all very well turning a healthy profit or recording a small net loss but quite simply the table does not lie.
While at the other end, Manchester City have shown that in their pursuit of greatness they have no issue in blowing the rest of the division out of the water as they record the highest net loss of last month.
There is no exact strategy as to how you play the transfer market, different clubs ultimately have different needs but the next few weeks and months will be the acid test as to just which teams got theirs correct. The eyes of the footballing world will be watching.
Add Sportslens to your Google News Feed!