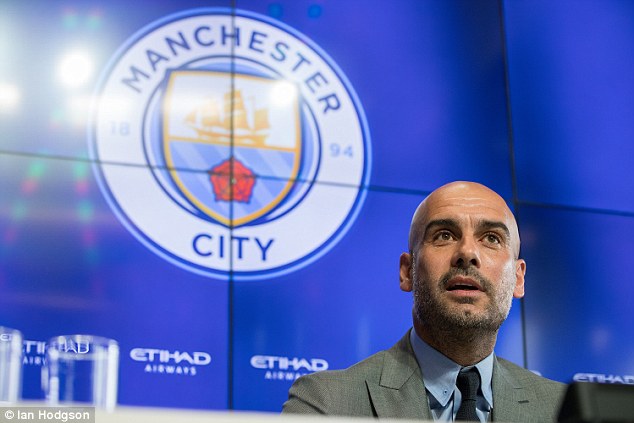
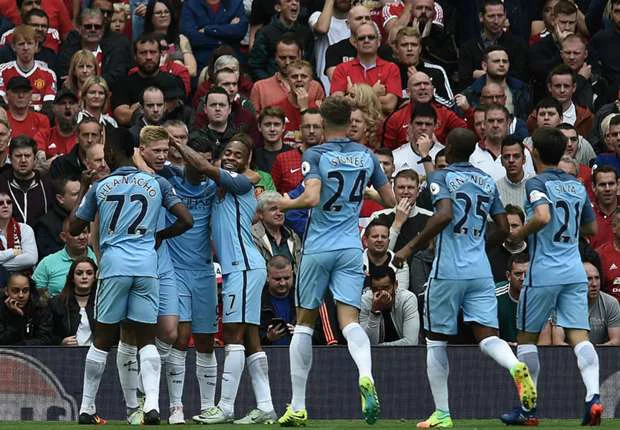
Manchester City made a flying start to the 2016/17 season under new manager Pep Guardiola, but their momentum seems to have stalled in recent weeks. After Celtic held them to a 3–3 draw in the Champions League, Guardiola’s City have gone on to lose at Tottenham Hotspur, draw at home against Everton, and get beaten 4–0 by Barcelona in the Champions League.
Manchester City's Premier League record this season is more or less identical to last season over the first 8 matches. #MCFC #UCL pic.twitter.com/RWnikCiz0D
— Gracenote Live (@GracenoteLive) October 19, 2016
The above tweet was posted hours before the kick-off at Camp Nou. Suddenly, the narrative of City producing better results under Guardiola was quashed. The Citizens had almost an identical Premier League record at the same stage last season, under Manuel Pellegrini.
But do those basic stats tell the whole story? Does it not look like City are a more sophisticated, tactically well-drilled unit under Guardiola than the languid force we saw last season?
Guardiola's Manchester City are making 3 FEWER goal attempts per match though than Pellegrini's City team did last season. #UCL #MCFC pic.twitter.com/2SZUeHMH5m
— Gracenote Live (@GracenoteLive) October 19, 2016
At the other end, Guardiola's Manchester City are conceding approximately the SAME number of goal attempts as Pellegrini's did. #MCFC #UCL pic.twitter.com/2jn2yYl5Gb
— Gracenote Live (@GracenoteLive) October 19, 2016
City were off to a good start in 2015/16 before tailing off spectacularly to somehow finish fourth. Guardiola’s new-look side this term are still in a transitional phase; the players are learning the manager’s methods, and the manager is getting used to English football.
But despite all the comparative numbers that suggest Pep’s City are underperforming Pellegrini’s side from last season, there are reasons to be optimistic for the City fans.
It isn’t all gloomy as those stats have made it sound. The underlying numbers tell more of the story of Pep’s City, and there are more positive signs than negative for Guardiola’s men. And, of course, they have been doing better than last season.
…..
For a start, Pep’s City are averaging more possession than last season. Possession of the ball, for Guardiola, is a means to an end, not the end. It, therefore, is little surprise to see his teams dominate ball possession, which is his way of controlling a game.
Although eight Premier League games constitute a very small sample size, certain trends can be seen in Pep’s City that show how they have been better under their new, Catalan manager this season.
Here is a look at the chances City have conceded thus far to their opponents this season.
All the figures have been calculated on a per 90 minutes (p90) basis, and also possession adjusted (since City have had greater possession this season than last).
The above graphic compares the amount of shots on target City have conceded this season with last season’s numbers, according to their locations. Although they have been conceding a greater number of shots on target this season, it is clear from the image that those have flown in far lesser from the dangerous areas inside the 18-yard box than last season.
More shots on target conceded from less dangerous areas means City have done well to provide lesser access to their opponents into their own box this term, despite the shot total going up.
Also, the number of shots on target conceded from inside the penalty area have decreased this season, suggesting City have improved as a defensive unit under Guardiola to restrict opponents to low quality shots.
Following is a look at location of the goals City have conceded from 2015/16 onward.
As evident from the graphic above, the amount of goals conceded from the most dangerous area that includes the goal area up to the penalty mark (the greenest block) have almost halved this season.
Most of the goals they have conceded have come from the area inside the 18-yard box and 11 or more yards from their goal.
…..
Offensively too, City have been producing better numbers than last season. They are expected to regress at some point of the season, but if they don’t, City will canter to the title unless another team can produce better.
Their shot accuracy has increased from 0.34 to 0.36 per shot this season. Also their shots to goals conversion has shot up under Guardiola this season from 0.12 to 0.14 per shot. Those are small gains, but gains nonetheless.
The above graphic compares City’s shots on target in 2015/16 and 2016/17. The numbers are almost identical, but the total shots attempted per 90 minutes have been higher this season as Pep’s City attempt close to one shot on target more every game.
The above graphic gives the location of the goals scored by City from the start of 2015/16. One thing of note is the increase in volume from inside the 18-yard box. City have scored goals from the most dangerous areas of their opponent’s penalty area, and that has resulted in their fine start under Guardiola.
However, the quality of chances created by Manchester City's opposition has also increased. City are giving up much bigger chances. #MCFC
— Gracenote Live (@GracenoteLive) October 19, 2016
City have conceded more shots to their opponents this season than they did last season, but that hasn’t translated into significantly more shots on target or more goals for their opponents.
They have also committed 0.625 errors leading to a shot or a goal this season compared to last season’s 0.368 per 90 minutes. But that is expected to come down considerably because of the overall quality of City’s players. Last season, their error count was exactly the same after eight games.
From eclectic formation choices to an unwavering stance on ball players all across the pitch, Guardiola has not been afraid to effect eye-catching changes. Despite all that, City are making better chances, and giving away less threatening ones to their opponents.
Guess the wide midfielders of #MCFC's 3-4-3 switched sides.
So it looks even more narrow than it was.#passmap pic.twitter.com/2DlY7osczv— 11tegen11 (@11tegen11) October 16, 2016
Overall, there are more than marginal signs of City’s improvement under Guardiola this season. Regardless of a tough few weeks dominated by individual errors and glaring misses, Pep’s City seem to be on an upward curve..
Related posts:
[catlist name=manchester-city numberposts=5]
Add Sportslens to your Google News Feed!
