Statistics are a key element to analysing football matches, but are all of them useful?
Basic figures such as shots, shots on target, yellow and red cards, and possession are displayed at various points during a televised match.
While some of these variables are rather concrete, if you are a football fanatic you may have thought to yourself at times that the possession statistic, in particular, can be rather misleading.
Teams such as Barcelona, Manchester City and Spain play a style of football in which their players prioritise keeping the ball.
At the end of a given match, these teams’ possession data may indicate that they had 70% possession.
However, much of their time with the ball is likely spent passing around the middle or defensive thirds of the pitch with little or no threat of scoring.
Rather than measuring solely how much time each team has control of the ball, perhaps a more useful possession measurement would involve field location as a variable.
This metric can be referred to as Purposeful Possession and “reward” possession of the football in more dangerous attacking locations on the pitch.
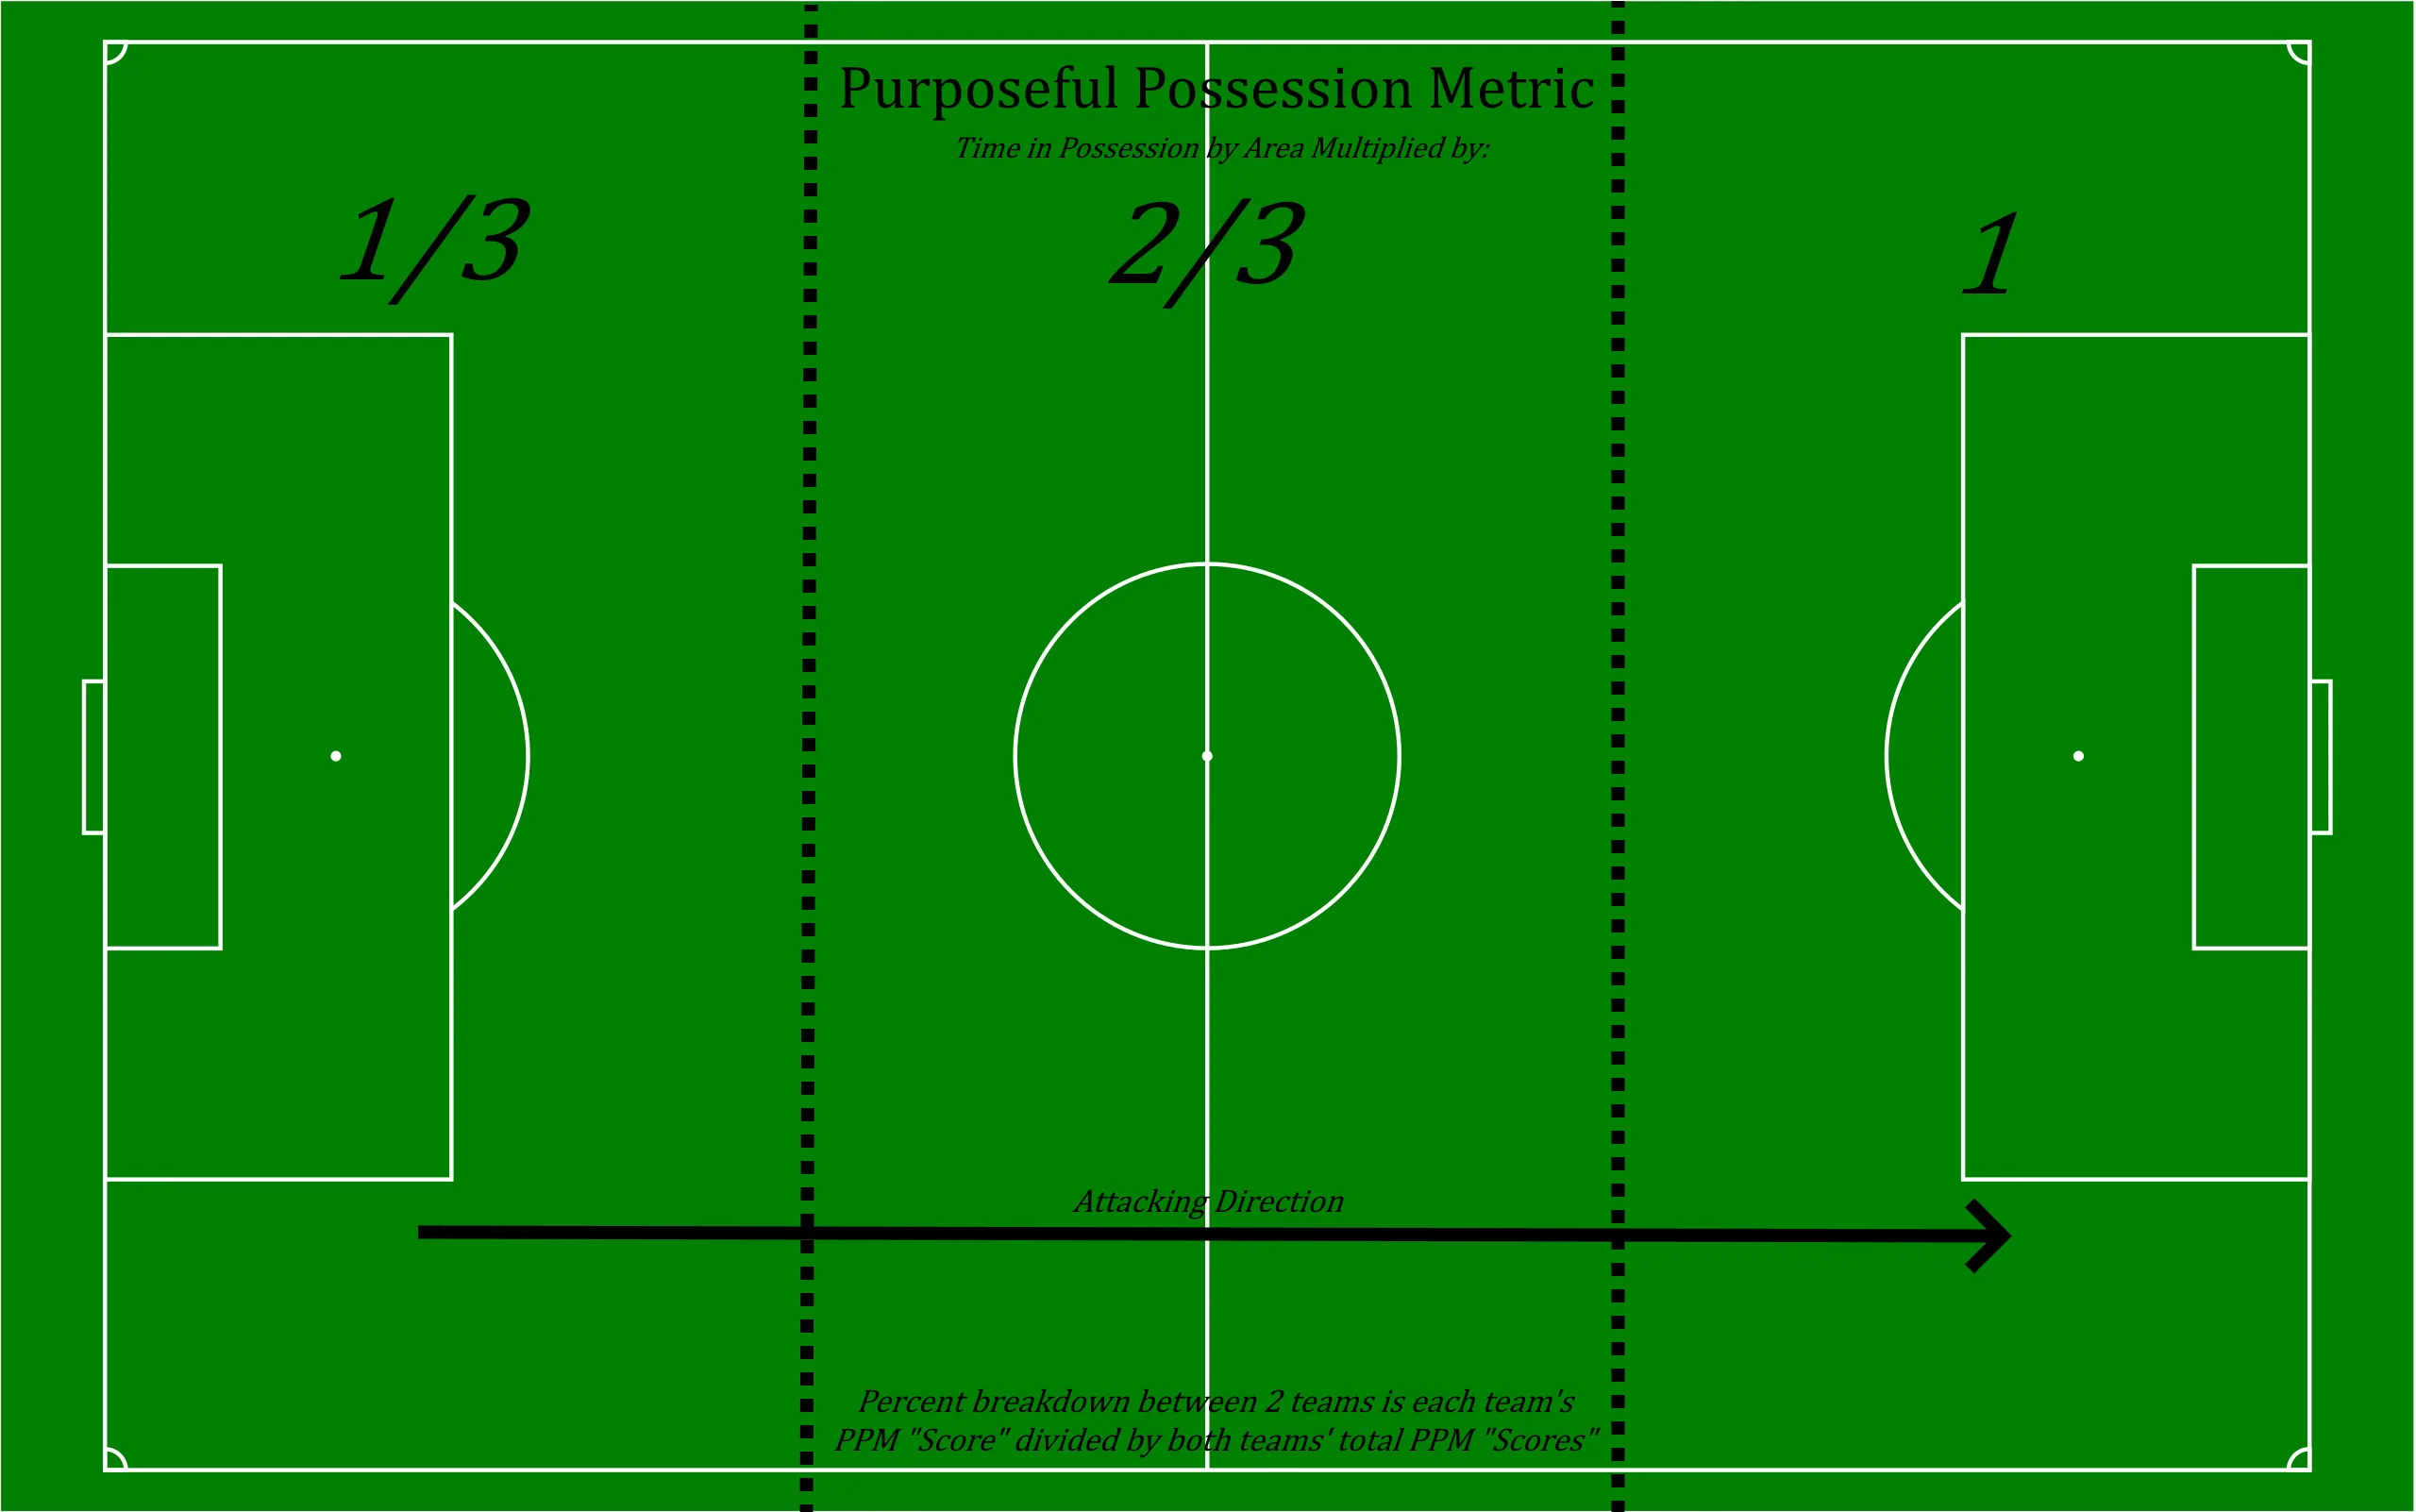
To keep things simple, the pitch can be split into thirds:

The total time spent in possession within a team’s defensive third is multiplied by a factor of 1/3.
Possession time in the middle third is then multiplied by 2/3, and the attacking third minutes stay the same.
A team’s Purposeful Possession Metric (PPM) score is then calculated by adding these three adjusted possession values and, when divided by the summation of both teams’ scores, we arrive at an easy-to-digest, displayable percentage.
For example, let’s consider the following data for minutes in possession by third for two teams:
Using the general possession statistic, Team B had 60% possession compared to Team B’s 40%.
However, Team A had most of their possession in the attacking third, whereas Team B had most of theirs in the defensive third.
The Purposeful Possession Metric suggests that when adding field location as a variable to possession, the game was much more evenly balanced than initially perceived, with Team A having 48.3% Purposeful Possession compared to Team B’s 51.7%.
A Purposeful Possession Metric, whether being the one mentioned in this article or otherwise, would greatly enhance a fan’s understanding of a given match and tell a better story of how a game truly unfolded.
This metric can not only be used to compare two teams in the same game but also to determine how effective a team is in general with their possession, measuring how often they get into threatening areas to score.
Read: Everton and Tottenham are keen on 26-goal star this summer.
Add Sportslens to your Google News Feed!

